
Exhibit 99.1 BigBear.ai NYSE:BBAI June 2023
Disclaimer Forward-Looking Statements This presentation contains forward-looking statements regarding future events and our future results that are subject to the safe harbors created under the Securities Act of 1933 (the “Securities Act”) and the Securities Exchange Act of 1934 (the “Exchange Act”). Forward-looking statements generally are accompanied by words such as “believe,” “may,” “will,” “estimate,” “continue,” “anticipate,” “intend,” “expect,” “should,” “would,” “plan,” “predict,” “potential,” “seem,” “seek,” “future,” “outlook,” and similar expressions that predict or indicate future events or trends or that are not statements of historical matters. These forward-looking statements include, but are not limited to, statements regarding our industry, future events, and other statements that are not historical facts. These statements are based on various assumptions, whether or not identified herein, and on the current expectations of our management and are not predictions of actual performance. These forward-looking statements are provided for illustrative purposes only and are not intended to serve as, and must not be relied on as, a guarantee, an assurance, a prediction or a definitive statement of fact or probability. Actual events and circumstances are difficult or impossible to predict and will differ from assumptions. Many actual events and circumstances are beyond our control. These forward- looking statements are subject to a number of risks and uncertainties, including those relating to: changes in domestic and foreign business, market, financial, political, and legal conditions; the uncertainty of projected financial information; delays caused by factors outside of our control, including changes in fiscal or contracting policies or decreases in available government funding; changes in government programs or applicable requirements; budgetary constraints, including automatic reductions as a result of “sequestration” or similar measures and constraints imposed by any lapses in appropriations for the federal government or certain of its departments and agencies; influence by, or competition from, third parties with respect to pending, new, or existing contracts with government customers; changes in our ability to successfully compete for and receive task orders and generate revenue under Indefinite Delivery/Indefinite Quantity contracts; our ability to realize the benefits of the strategic partnerships; potential delays or changes in the government appropriations or procurement processes, including as a result of events such as war, incidents of terrorism, natural disasters, and public health concerns or epidemics, such as the coronavirus outbreak; the identified material weakness in our internal controls over financial reporting (including the timeline to remediate the material weakness); increased or unexpected costs or unanticipated delays caused by other factors outside of our control, such as performance failures of our subcontractors; the rollout of the business and the timing of expected business milestones; the effects of competition on our future business; our ability to obtain and access financing in the future; and those factors discussed in the Company’s reports and other documents filed with the SEC, including under the heading “Risk Factors.” If any of these risks materialize or our assumptions prove incorrect, actual results could differ materially from the results implied by these forward-looking statements. There may be additional risks that we presently does not know or that we currently believe are immaterial which could also cause actual results to differ from those contained in the forward-looking statements. In addition, forward-looking statements reflect our expectations, plans or forecasts of future events and views as of the date of this presentation. We anticipate that subsequent events and developments will cause our assessments to change. However, we specifically disclaims any obligation to do so. Accordingly, undue reliance should not be placed upon the forward-looking statements. Non-GAAP Financial Information This presentation includes financial measures that are not in accordance with generally accepted accounting principles (“GAAP”), such as EBITDA, Adjusted EBITDA, Adjusted Gross Margin and Recurring Operating Expenses. We believe these non-GAAP financial measures provide investors and analysts with useful supplemental information about the financial performance of our business, enable comparison of financial results between periods where certain items may vary independent of business performance, and allow for greater transparency with respect to key measures used by management to operate and analyze our business over different periods of time. Non-GAAP financial measures should not be considered in isolation or as a substitute for the relevant GAAP measures and should be read in conjunction with information presented on a GAAP basis. In addition, they are subject to inherent limitations as they reflect the exercise of judgment by management about which expense and income items are excluded or included in determining these non-GAAP financial measures. Because not all companies use identical calculations, our presentation of non-GAAP measures may not be comparable to other similarly titled measures of other companies. In addition, certain 2020 financial information represents combined predecessor and successor information. EBITDA is defined as net (loss) before interest expense, income tax expense, depreciation and amortization. Adjusted EBITDA is defined as EBITDA further adjusted for equity-based compensation, employer payroll taxes related to equity-based compensation, net increase (decrease) in fair value of derivatives, restructuring charges, loss on extinguishment of debt, transaction bonuses, capital market advisory fees, termination of legacy benefits, management fees, non-recurring integration costs and strategic initiatives, commercial start-up costs, transaction expenses and goodwill impairment. Adjusted EBITDA Margin is defined as Adjusted EBITDA as a percentage of Revenue. Recurring Operating Expenses is defined as total operating expense as adjusted for equity-based compensation expense in selling, general and administrative, equity-based compensation expense in research and development, restructuring charges, capital market advisory fees, non-recurring integration costs and strategic initiatives, accounts receivable reserves related to Virgin Orbit, transaction expenses and goodwill impairment. Reconciliations to the most directly comparable GAAP measures is provided in the Appendix to this presentation. We do not reconcile forward-looking non-GAAP financial measures to the most directly comparable GAAP financial measure because we are not able to do so without unreasonable effort. Certain elements of the composition of the GAAP amounts are not predictable, making it impracticable for us to forecast. For the same reasons, we are unable to assess the probable significance of the unavailable information, which could have a potentially significant impact on our results of operations. 2
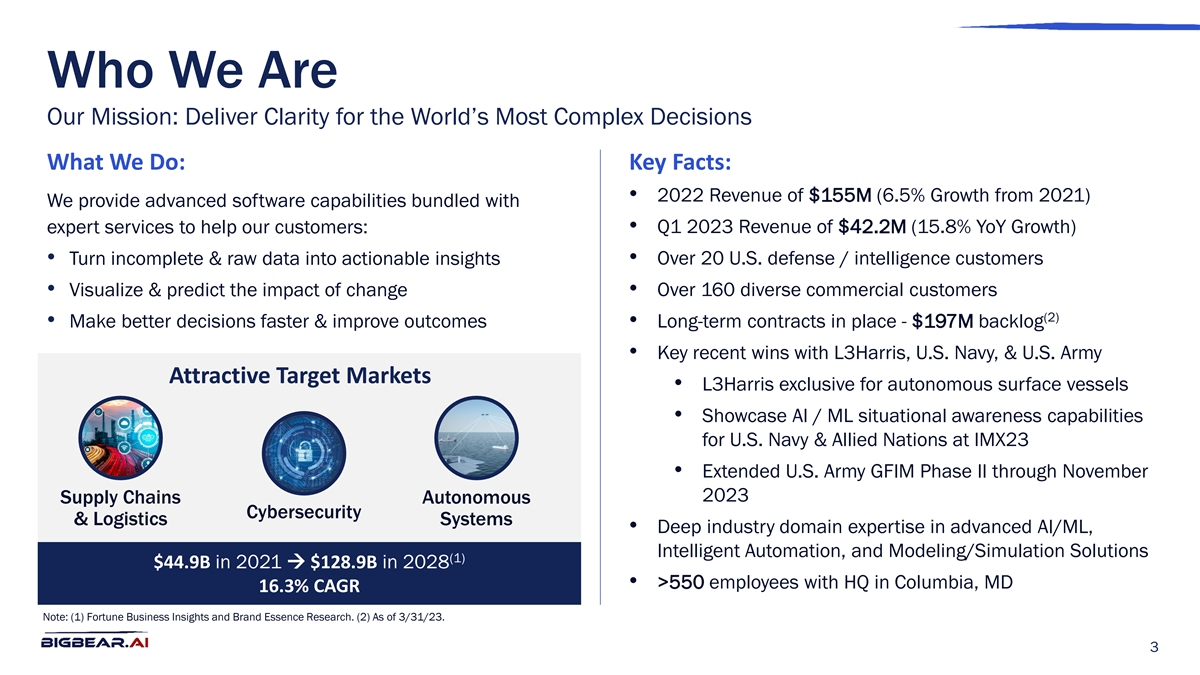
Who We Are Our Mission: Deliver Clarity for the World’s Most Complex Decisions What We Do: Key Facts: • 2022 Revenue of $155M (6.5% Growth from 2021) We provide advanced software capabilities bundled with expert services to help our customers: • Q1 2023 Revenue of $42.2M (15.8% YoY Growth) • Turn incomplete & raw data into actionable insights • Over 20 U.S. defense / intelligence customers • Visualize & predict the impact of change • Over 160 diverse commercial customers (2) • Make better decisions faster & improve outcomes • Long-term contracts in place - $197M backlog • Key recent wins with L3Harris, U.S. Navy, & U.S. Army Attractive Target Markets • L3Harris exclusive for autonomous surface vessels • Showcase AI / ML situational awareness capabilities for U.S. Navy & Allied Nations at IMX23 • Extended U.S. Army GFIM Phase II through November 2023 Supply Chains Autonomous Cybersecurity & Logistics Systems • Deep industry domain expertise in advanced AI/ML, Intelligent Automation, and Modeling/Simulation Solutions (1) $44.9B in 2021à $128.9B in 2028 • >550 employees with HQ in Columbia, MD 16.3% CAGR Note: (1) Fortune Business Insights and Brand Essence Research. (2) As of 3/31/23. 3
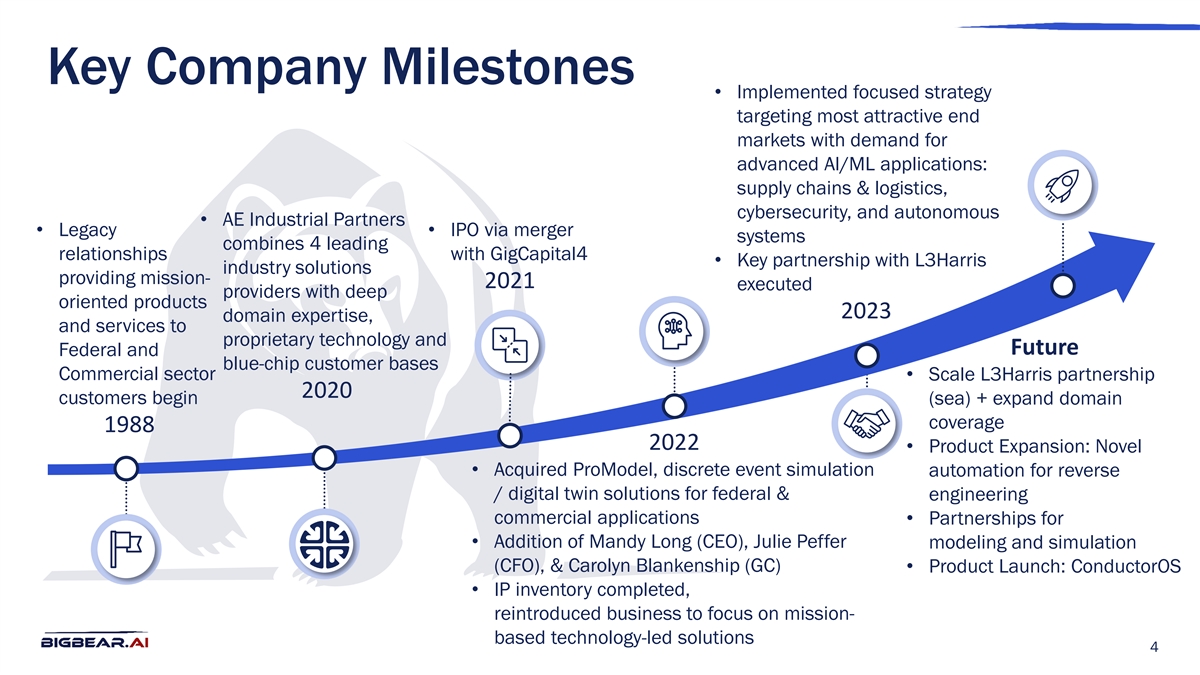
Key Company Milestones • Implemented focused strategy targeting most attractive end markets with demand for advanced AI/ML applications: supply chains & logistics, cybersecurity, and autonomous • AE Industrial Partners • Legacy • IPO via merger systems combines 4 leading relationships with GigCapital4 • Key partnership with L3Harris industry solutions providing mission- 2021 executed providers with deep oriented products 2023 domain expertise, and services to proprietary technology and Future Federal and blue-chip customer bases Commercial sector • Scale L3Harris partnership 2020 customers begin (sea) + expand domain coverage 1988 2022 • Product Expansion: Novel • Acquired ProModel, discrete event simulation automation for reverse / digital twin solutions for federal & engineering commercial applications • Partnerships for • Addition of Mandy Long (CEO), Julie Peffer modeling and simulation (CFO), & Carolyn Blankenship (GC) • Product Launch: ConductorOS • IP inventory completed, reintroduced business to focus on mission- based technology-led solutions 4
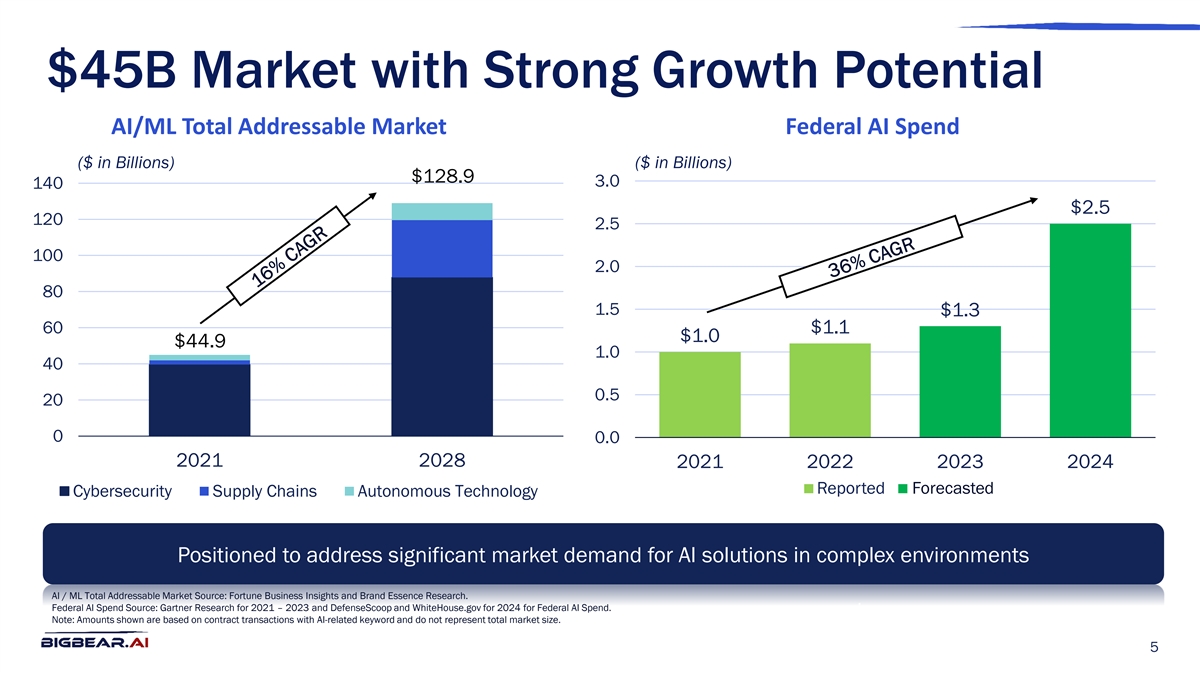
$45B Market with Strong Growth Potential AI/ML Total Addressable Market Federal AI Spend ($ in Billions) ($ in Billions) $128.9 3.0 140 $2.5 120 2.5 100 2.0 80 1.5 $1.3 60 $1.1 $1.0 $44.9 1.0 40 0.5 20 0 0.0 2021 2028 2021 2022 2023 2024 Reported Forecasted Cybersecurity Supply Chains Autonomous Technology Positioned to address significant market demand for AI solutions in complex environments AI / ML Total Addressable Market Source: Fortune Business Insights and Brand Essence Research. Federal AI Spend Source: Gartner Research for 2021 – 2023 and DefenseScoop and WhiteHouse.gov for 2024 for Federal AI Spend. Note: Amounts shown are based on contract transactions with AI-related keyword and do not represent total market size. 5
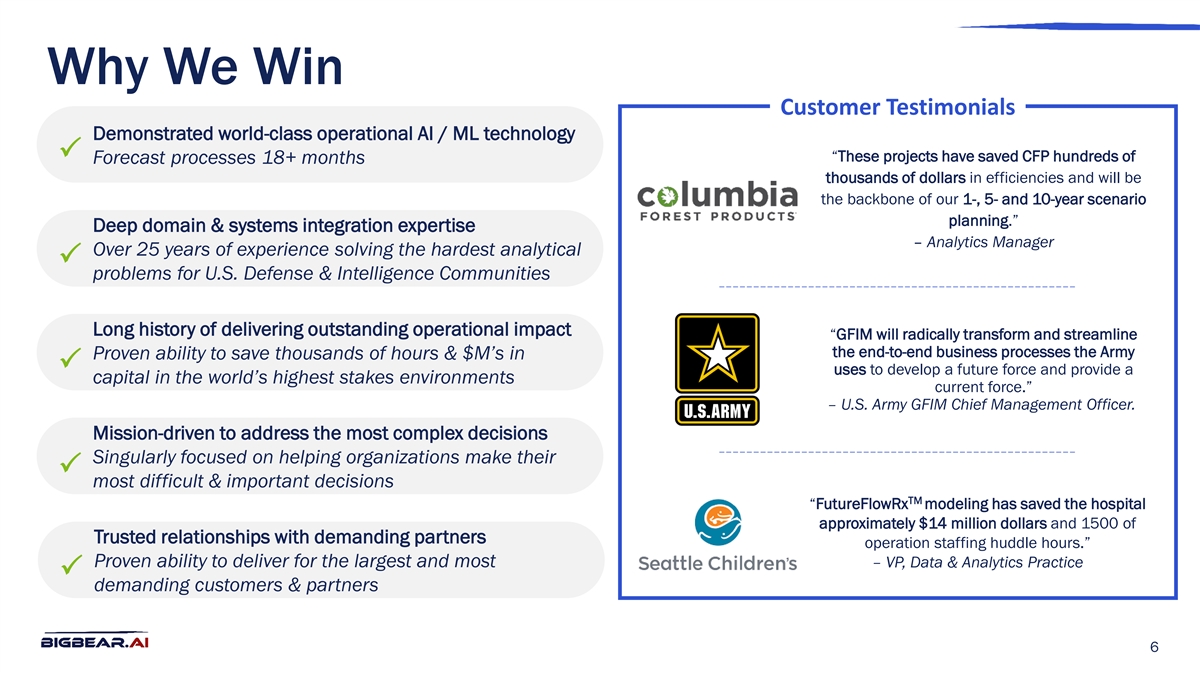
Why We Win Customer Testimonials Demonstrated world-class operational AI / ML technology P “These projects have saved CFP hundreds of Forecast processes 18+ months thousands of dollars in efficiencies and will be the backbone of our 1-, 5- and 10-year scenario planning.” Deep domain & systems integration expertise – Analytics Manager Over 25 years of experience solving the hardest analytical P problems for U.S. Defense & Intelligence Communities Long history of delivering outstanding operational impact “GFIM will radically transform and streamline the end-to-end business processes the Army Proven ability to save thousands of hours & $M’s in P uses to develop a future force and provide a capital in the world’s highest stakes environments current force.” – U.S. Army GFIM Chief Management Officer. Mission-driven to address the most complex decisions Singularly focused on helping organizations make their P most difficult & important decisions TM “FutureFlowRx modeling has saved the hospital approximately $14 million dollars and 1500 of Trusted relationships with demanding partners operation staffing huddle hours.” Proven ability to deliver for the largest and most – VP, Data & Analytics Practice P demanding customers & partners 6
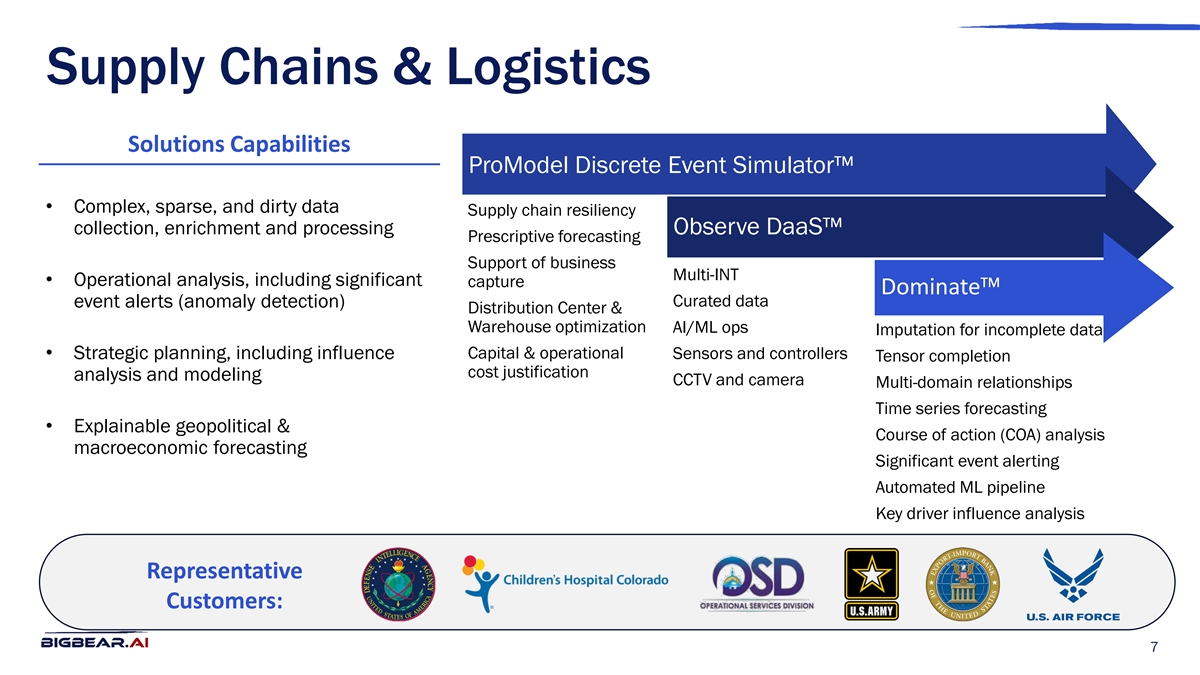
Supply Chains & Logistics Solutions Capabilities ProModel Discrete Event Simulator™ • Complex, sparse, and dirty data Supply chain resiliency collection, enrichment and processing Observe DaaS™ Prescriptive forecasting Support of business Multi-INT • Operational analysis, including significant capture Dominate™ Curated data event alerts (anomaly detection) Distribution Center & Warehouse optimization AI/ML ops Imputation for incomplete data • Strategic planning, including influence Capital & operational Sensors and controllers Tensor completion cost justification analysis and modeling CCTV and camera Multi-domain relationships Time series forecasting • Explainable geopolitical & Course of action (COA) analysis macroeconomic forecasting Significant event alerting Automated ML pipeline Key driver influence analysis Representative Customers: 7
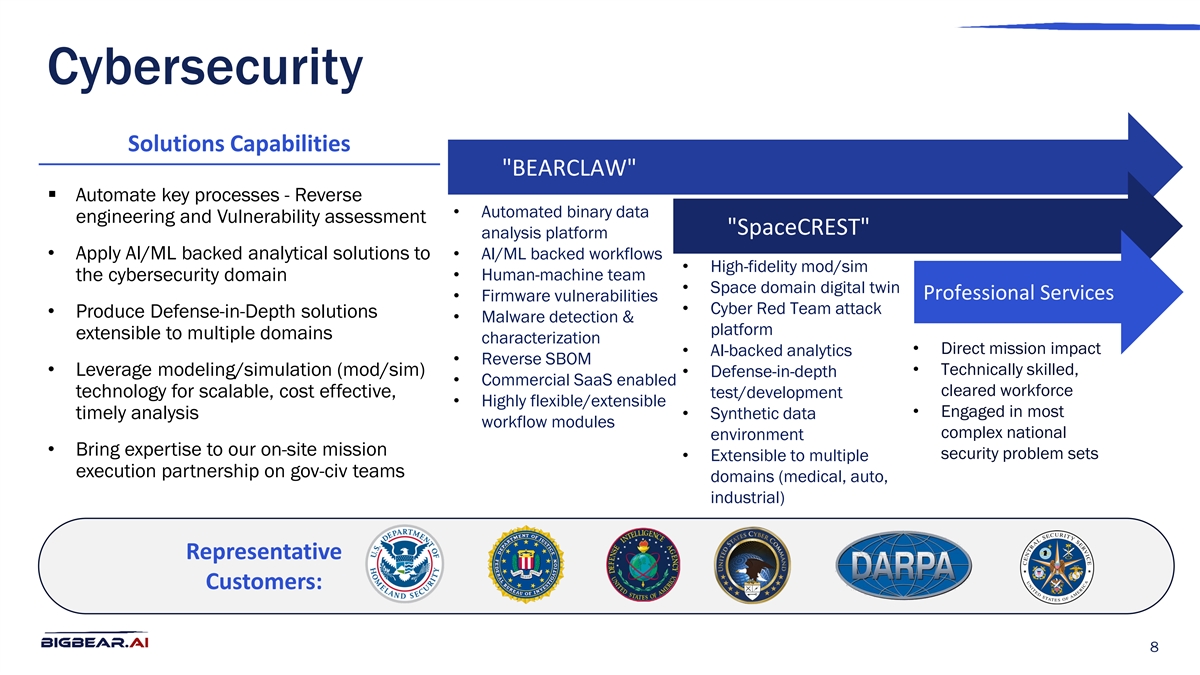
Cybersecurity Solutions Capabilities BEARCLAW § Automate key processes - Reverse • Automated binary data engineering and Vulnerability assessment SpaceCREST analysis platform • Apply AI/ML backed analytical solutions to • AI/ML backed workflows • High-fidelity mod/sim the cybersecurity domain • Human-machine team • Space domain digital twin Professional Services • Firmware vulnerabilities • Cyber Red Team attack • Produce Defense-in-Depth solutions • Malware detection & platform extensible to multiple domains characterization • Direct mission impact • AI-backed analytics • Reverse SBOM • Technically skilled, • Leverage modeling/simulation (mod/sim) • Defense-in-depth • Commercial SaaS enabled cleared workforce technology for scalable, cost effective, test/development • Highly flexible/extensible • Engaged in most timely analysis • Synthetic data workflow modules complex national environment • Bring expertise to our on-site mission security problem sets • Extensible to multiple execution partnership on gov-civ teams domains (medical, auto, industrial) Representative Customers: 8
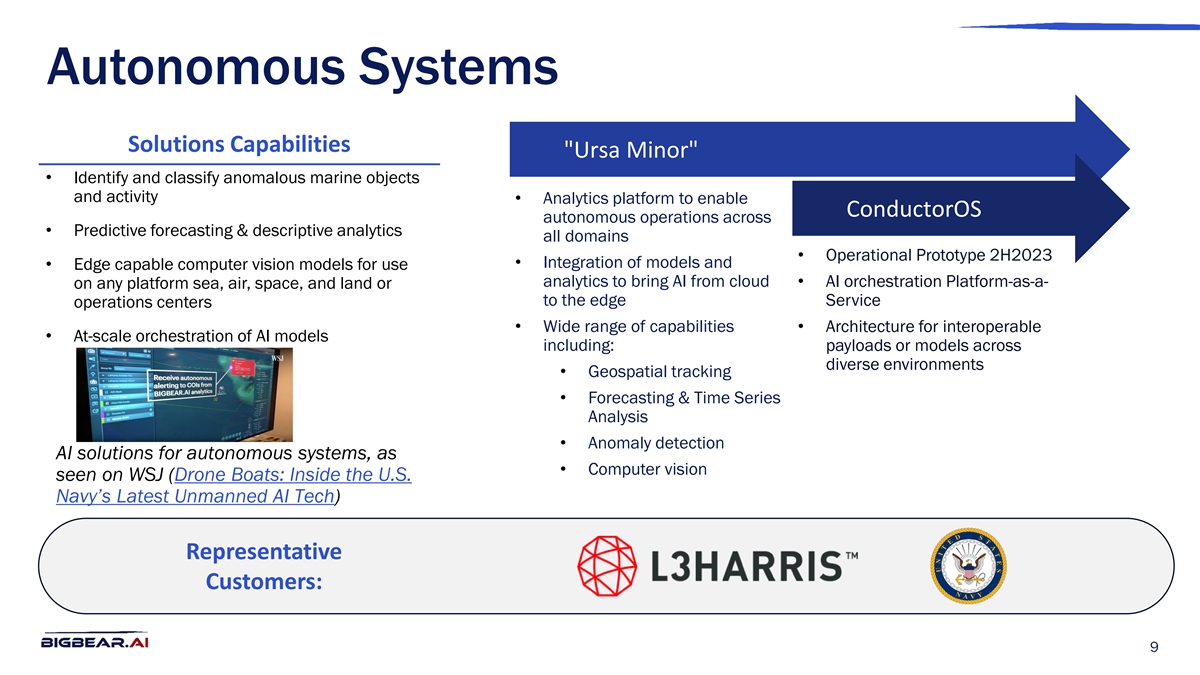
Autonomous Systems Solutions Capabilities Ursa Minor • Identify and classify anomalous marine objects and activity • Analytics platform to enable ConductorOS autonomous operations across • Predictive forecasting & descriptive analytics all domains • Operational Prototype 2H2023 • Integration of models and • Edge capable computer vision models for use analytics to bring AI from cloud • AI orchestration Platform-as-a- on any platform sea, air, space, and land or to the edge Service operations centers • Wide range of capabilities • Architecture for interoperable • At-scale orchestration of AI models including: payloads or models across diverse environments • Geospatial tracking • Forecasting & Time Series Analysis • Anomaly detection AI solutions for autonomous systems, as • Computer vision seen on WSJ (Drone Boats: Inside the U.S. Navy’s Latest Unmanned AI Tech) Representative Customers: 9
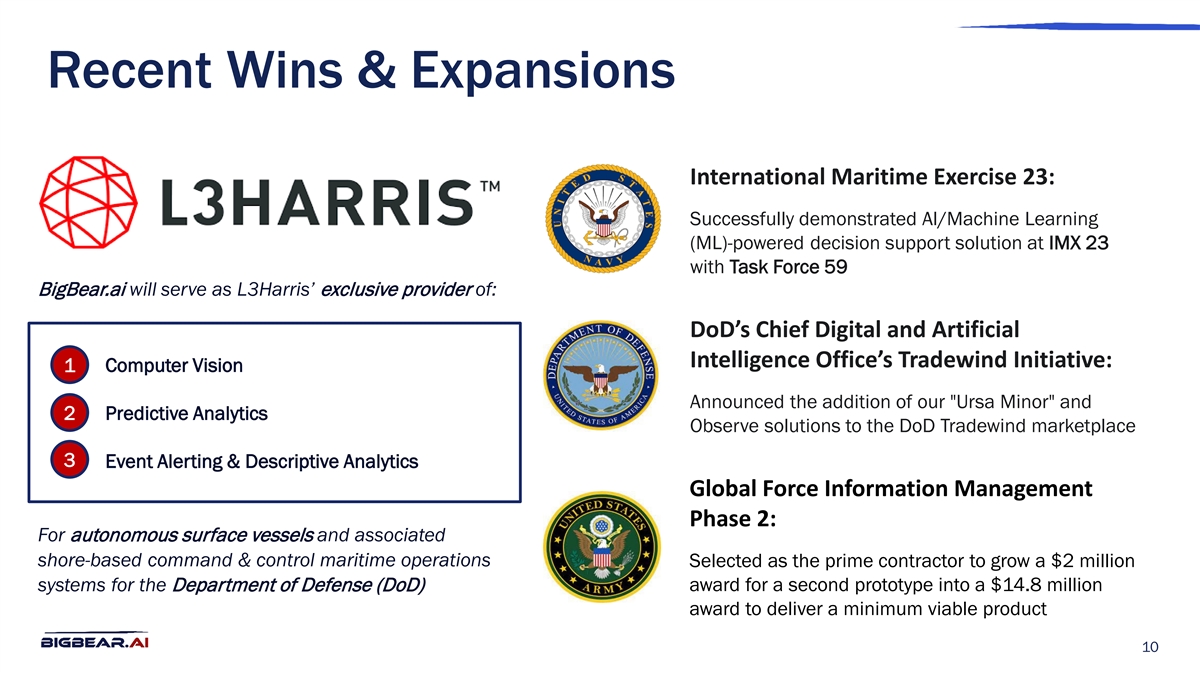
Recent Wins & Expansions International Maritime Exercise 23: Successfully demonstrated AI/Machine Learning (ML)-powered decision support solution at IMX 23 with Task Force 59 BigBear.ai will serve as L3Harris’ exclusive provider of: DoD’s Chief Digital and Artificial Intelligence Office’s Tradewind Initiative: 1 Computer Vision Announced the addition of our Ursa Minor and 2 Predictive Analytics Observe solutions to the DoD Tradewind marketplace 3 Event Alerting & Descriptive Analytics Global Force Information Management Phase 2: For autonomous surface vessels and associated shore-based command & control maritime operations Selected as the prime contractor to grow a $2 million systems for the Department of Defense (DoD) award for a second prototype into a $14.8 million award to deliver a minimum viable product 10
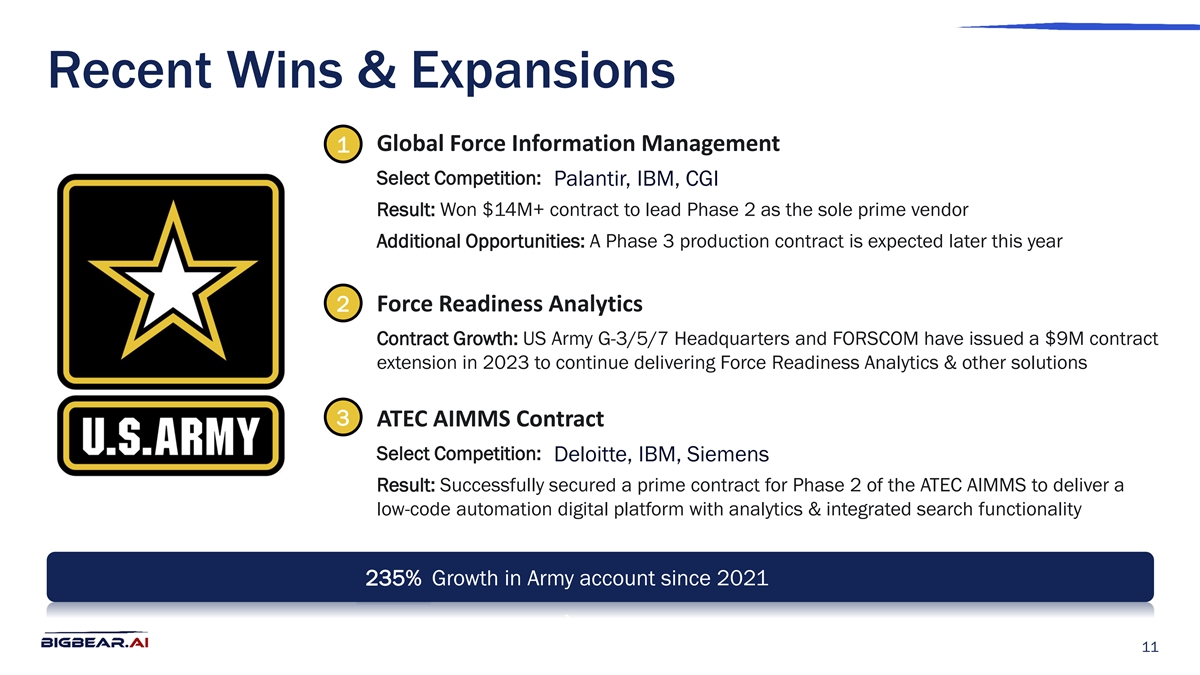
Recent Wins & Expansions Global Force Information Management 1 Select Competition: Palantir, IBM, CGI Result: Won $14M+ contract to lead Phase 2 as the sole prime vendor Additional Opportunities: A Phase 3 production contract is expected later this year 2 Force Readiness Analytics Contract Growth: US Army G-3/5/7 Headquarters and FORSCOM have issued a $9M contract extension in 2023 to continue delivering Force Readiness Analytics & other solutions 3 ATEC AIMMS Contract Select Competition: Deloitte, IBM, Siemens Result: Successfully secured a prime contract for Phase 2 of the ATEC AIMMS to deliver a low-code automation digital platform with analytics & integrated search functionality 235% Growth in Army account since 2021 11
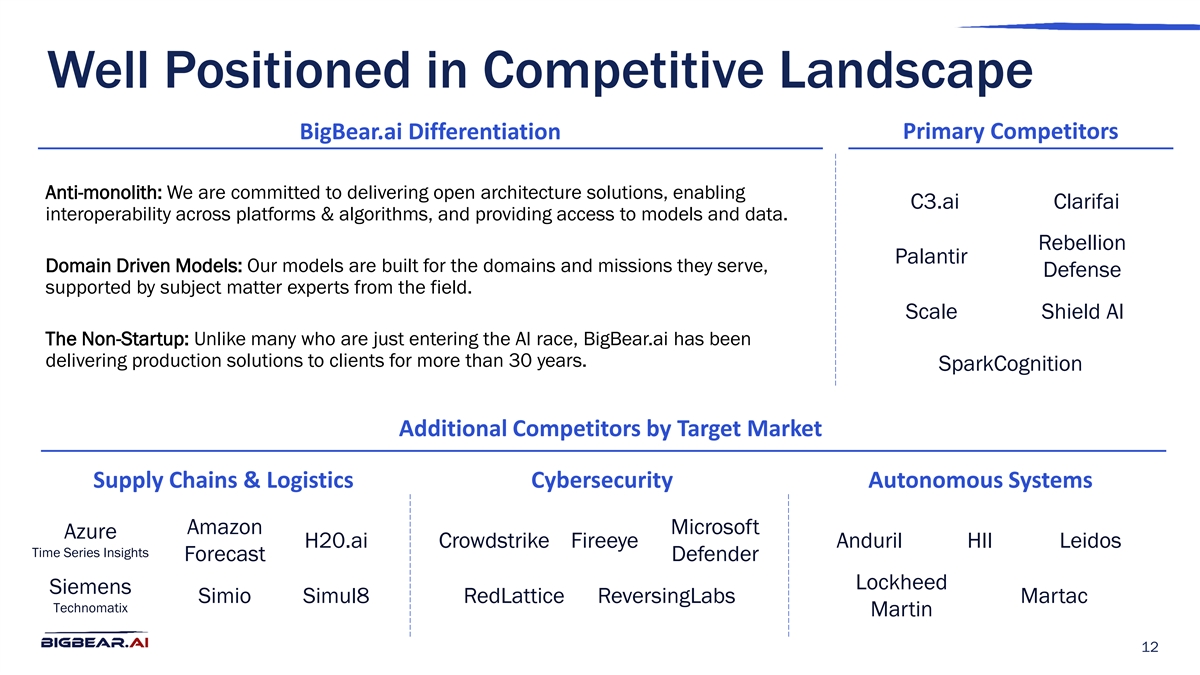
Well Positioned in Competitive Landscape Primary Competitors BigBear.ai Differentiation Anti-monolith: We are committed to delivering open architecture solutions, enabling C3.ai Clarifai interoperability across platforms & algorithms, and providing access to models and data. Rebellion Palantir Domain Driven Models: Our models are built for the domains and missions they serve, Defense supported by subject matter experts from the field. Scale Shield AI The Non-Startup: Unlike many who are just entering the AI race, BigBear.ai has been delivering production solutions to clients for more than 30 years. SparkCognition Additional Competitors by Target Market Supply Chains & Logistics Cybersecurity Autonomous Systems Amazon Microsoft Azure H20.ai Crowdstrike Fireeye Anduril HII Leidos Time Series Insights Forecast Defender Lockheed Siemens Simio Simul8 RedLattice ReversingLabs Martac Technomatix Martin 12
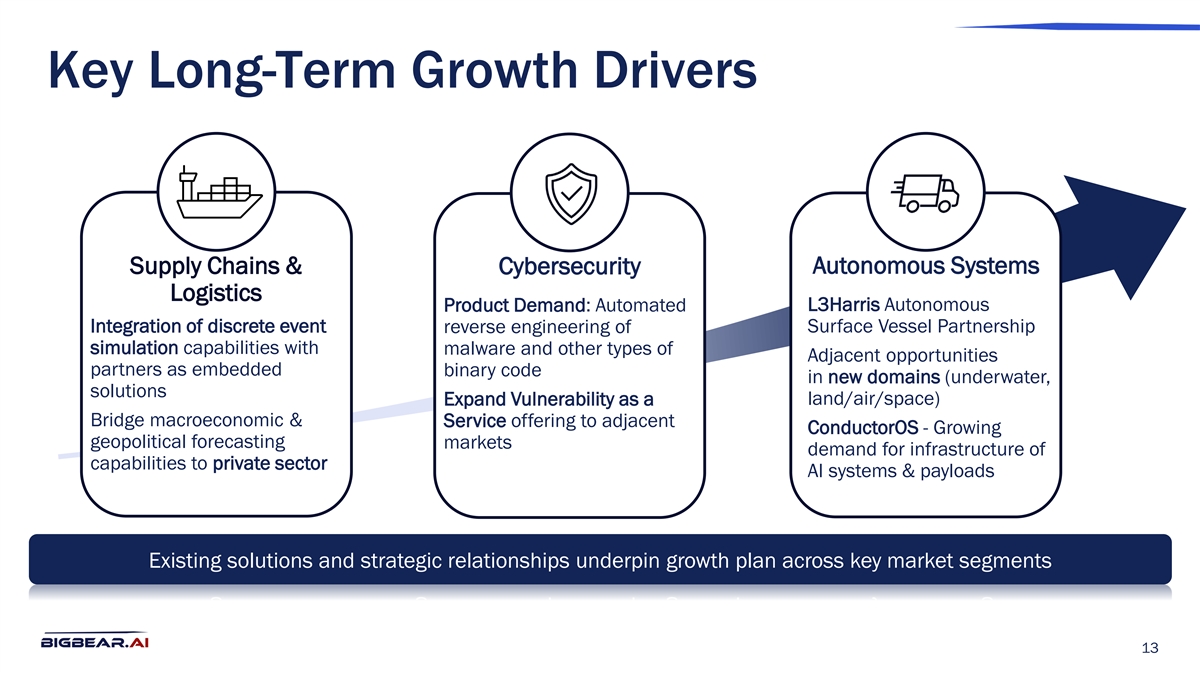
Key Long-Term Growth Drivers Supply Chains & Cybersecurity Autonomous Systems Logistics Product Demand: Automated L3Harris Autonomous Integration of discrete event Surface Vessel Partnership reverse engineering of simulation capabilities with malware and other types of Adjacent opportunities partners as embedded binary code in new domains (underwater, solutions Expand Vulnerability as a land/air/space) Bridge macroeconomic & Service offering to adjacent ConductorOS - Growing geopolitical forecasting markets demand for infrastructure of capabilities to private sector AI systems & payloads Existing solutions and strategic relationships underpin growth plan across key market segments 13
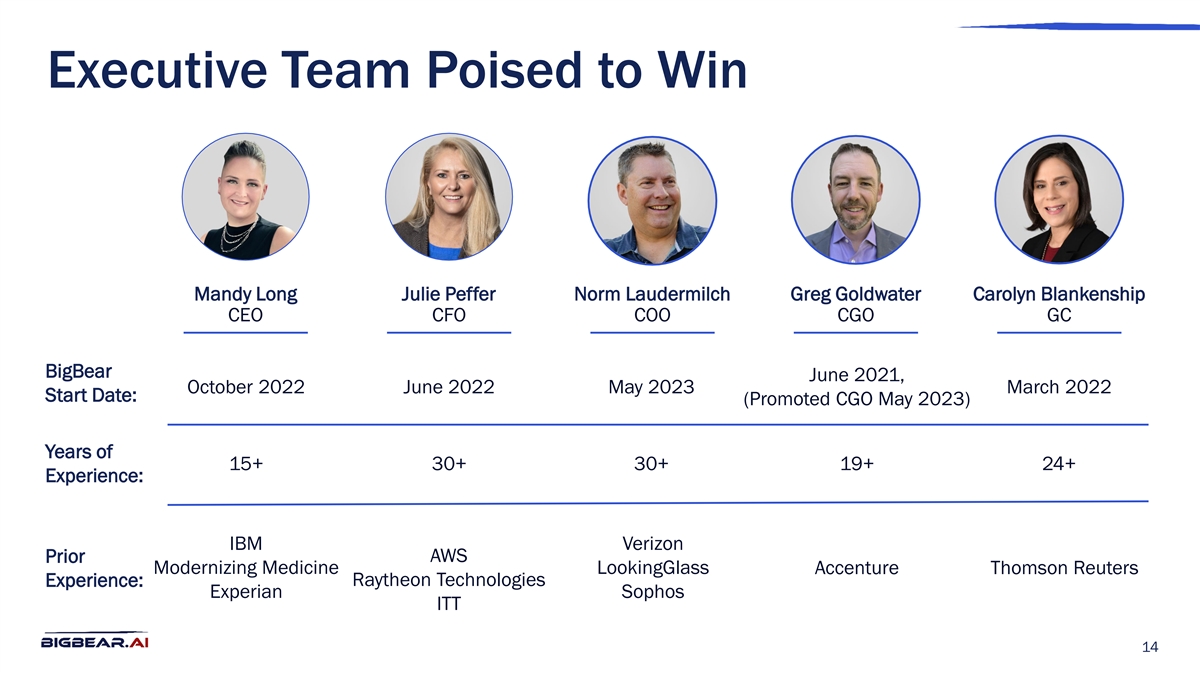
Executive Team Poised to Win Mandy Long Julie Peffer Norm Laudermilch Greg Goldwater Carolyn Blankenship CEO CFO COO CGO GC BigBear June 2021, October 2022 June 2022 May 2023 March 2022 Start Date: (Promoted CGO May 2023) Years of 15+ 30+ 30+ 19+ 24+ Experience: IBM Verizon Prior AWS Modernizing Medicine LookingGlass Accenture Thomson Reuters Raytheon Technologies Experience: Experian Sophos ITT 14

Financials 15
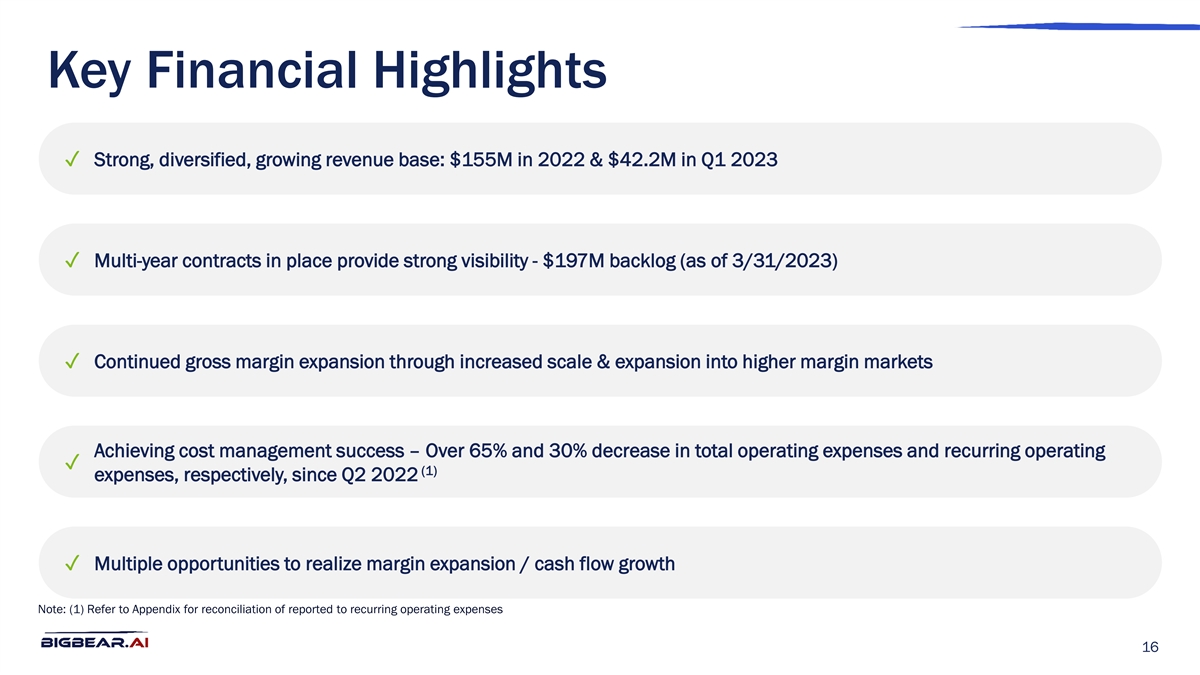
Key Financial Highlights ✓ Strong, diversified, growing revenue base: $155M in 2022 & $42.2M in Q1 2023 ✓ Multi-year contracts in place provide strong visibility - $197M backlog (as of 3/31/2023) ✓ Continued gross margin expansion through increased scale & expansion into higher margin markets Achieving cost management success – Over 65% and 30% decrease in total operating expenses and recurring operating ✓ (1) expenses, respectively, since Q2 2022 ✓ Multiple opportunities to realize margin expansion / cash flow growth Note: (1) Refer to Appendix for reconciliation of reported to recurring operating expenses 16
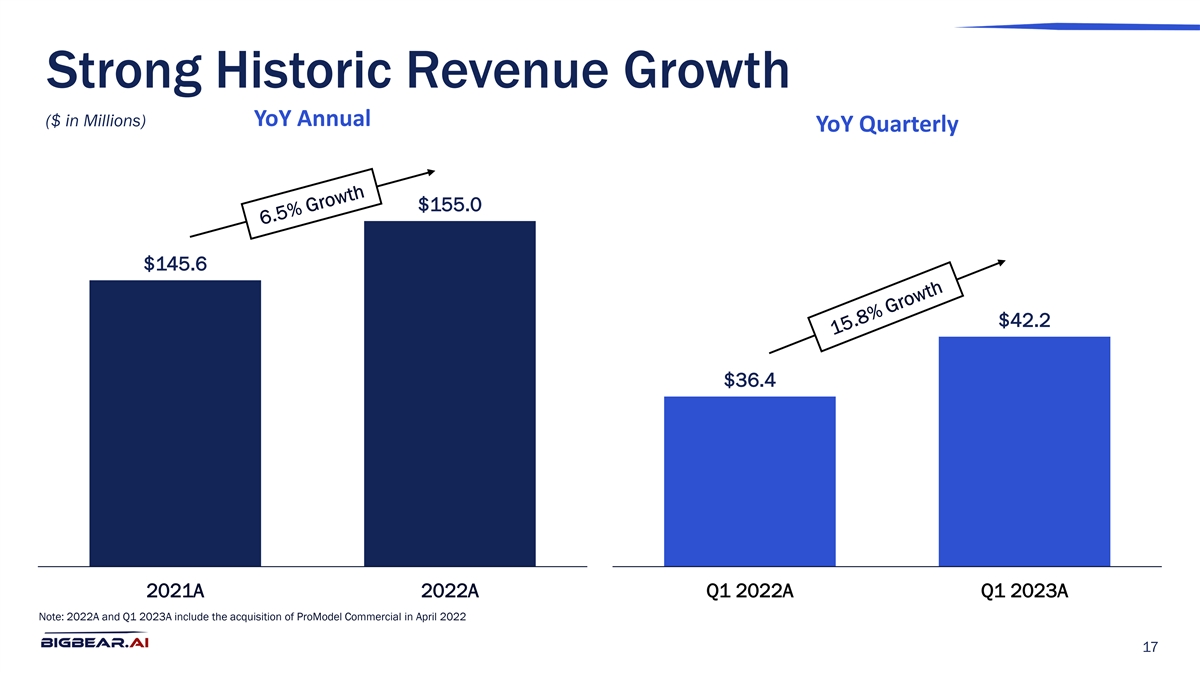
Strong Historic Revenue Growth ($ in Millions) YoY Annual YoY Quarterly $155.0 $145.6 $42.2 $36.4 2021A 2022A Q1 2022A Q1 2023A Note: 2022A and Q1 2023A include the acquisition of ProModel Commercial in April 2022 17
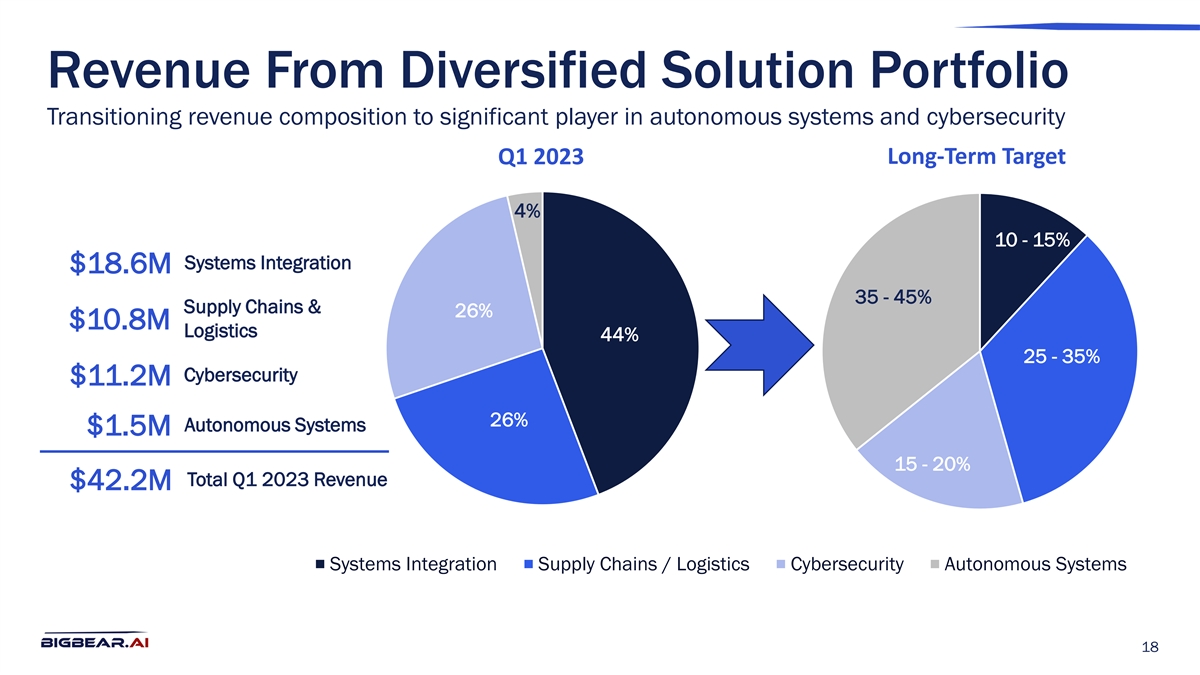
Revenue From Diversified Solution Portfolio Transitioning revenue composition to significant player in autonomous systems and cybersecurity Long-Term Target Q1 2023 4% 10 - 15% Systems Integration $18.6M 35 - 45% Supply Chains & 26% $10.8M Logistics 44% 25 - 35% Cybersecurity $11.2M 26% Autonomous Systems $1.5M 15 - 20% Total Q1 2023 Revenue $42.2M Systems Integration Supply Chains / Logistics Cybersecurity Autonomous Systems 18
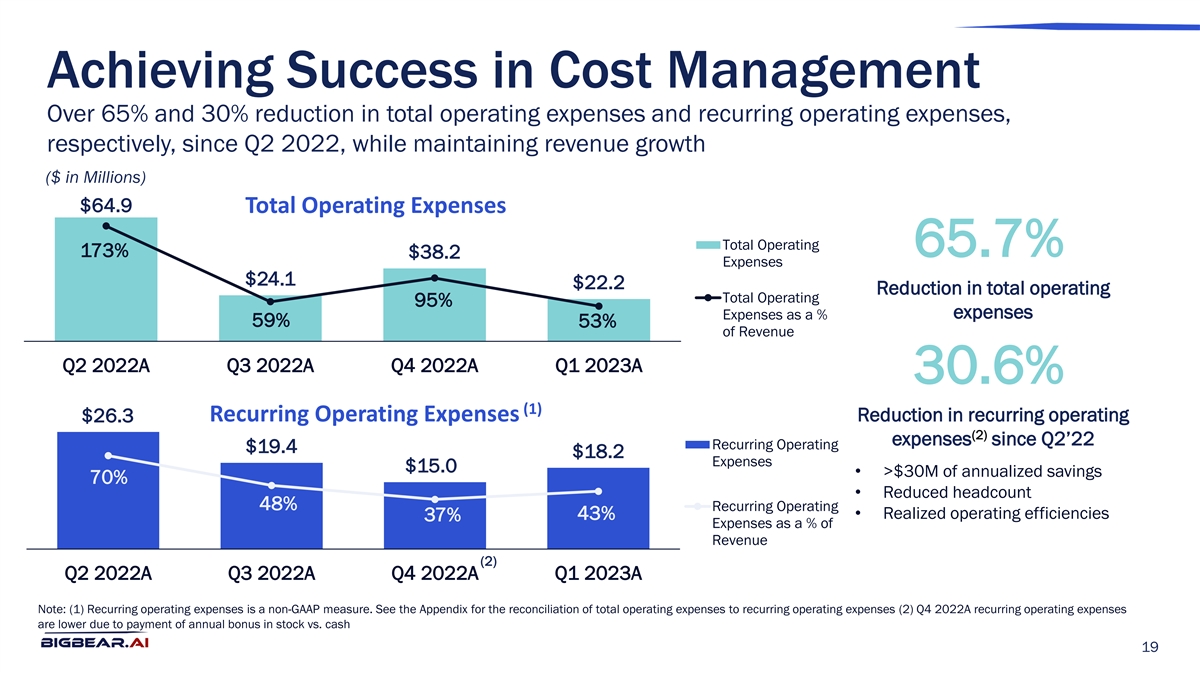
Achieving Success in Cost Management Over 65% and 30% reduction in total operating expenses and recurring operating expenses, respectively, since Q2 2022, while maintaining revenue growth ($ in Millions) $64.9 Total Operating Expenses Total Operating 65.7% 173% $38.2 Expenses $24.1 $22.2 Reduction in total operating Total Operating 95% expenses Expenses as a % 59% 53% of Revenue Q2 2022A Q3 2022A Q4 2022A Q1 2023A 30.6% (1) Recurring Operating Expenses Reduction in recurring operating $26.3 (2) expenses since Q2’22 Recurring Operating $19.4 $18.2 Expenses $15.0 • >$30M of annualized savings 70% • Reduced headcount 48% Recurring Operating • Realized operating efficiencies 43% 37% Expenses as a % of Revenue (2) Q2 2022A Q3 2022A Q4 2022A Q1 2023A Note: (1) Recurring operating expenses is a non-GAAP measure. See the Appendix for the reconciliation of total operating expenses to recurring operating expenses (2) Q4 2022A recurring operating expenses are lower due to payment of annual bonus in stock vs. cash 19
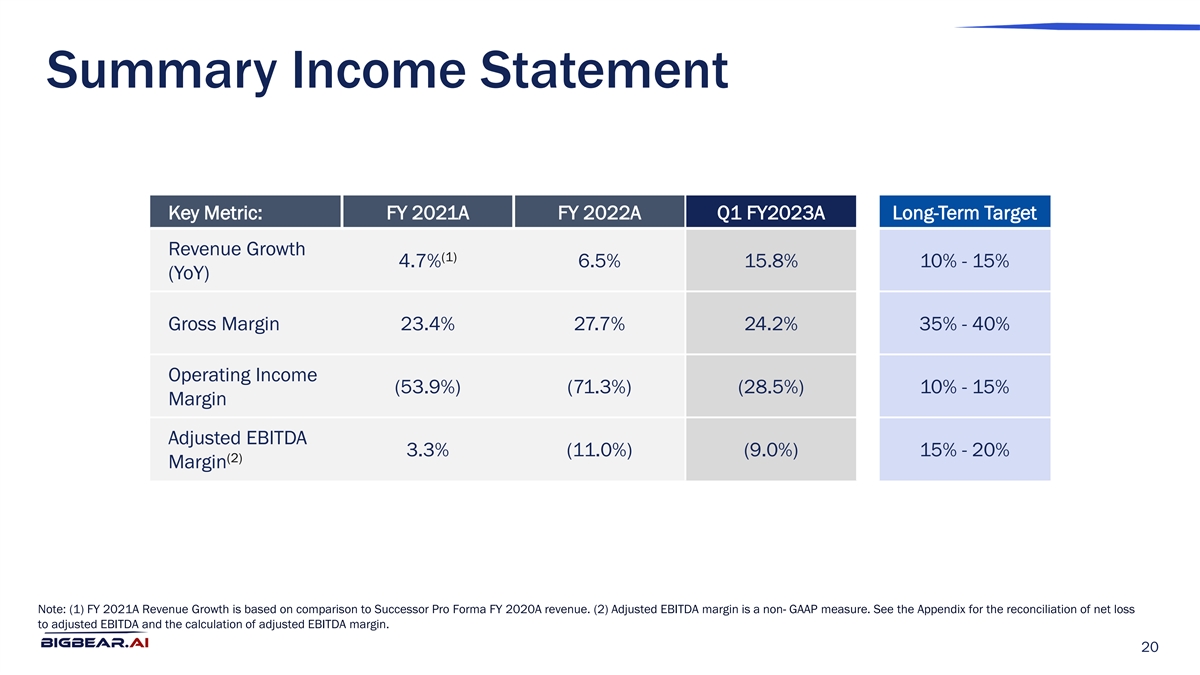
Summary Income Statement Key Metric: FY 2021A FY 2022A Q1 FY2023A Long-Term Target Revenue Growth (1) 4.7% 6.5% 15.8% 10% - 15% (YoY) Gross Margin 23.4% 27.7% 24.2% 35% - 40% Operating Income (53.9%) (71.3%) (28.5%) 10% - 15% Margin Adjusted EBITDA 3.3% (11.0%) (9.0%) 15% - 20% (2) Margin Note: (1) FY 2021A Revenue Growth is based on comparison to Successor Pro Forma FY 2020A revenue. (2) Adjusted EBITDA margin is a non- GAAP measure. See the Appendix for the reconciliation of net loss to adjusted EBITDA and the calculation of adjusted EBITDA margin. 20
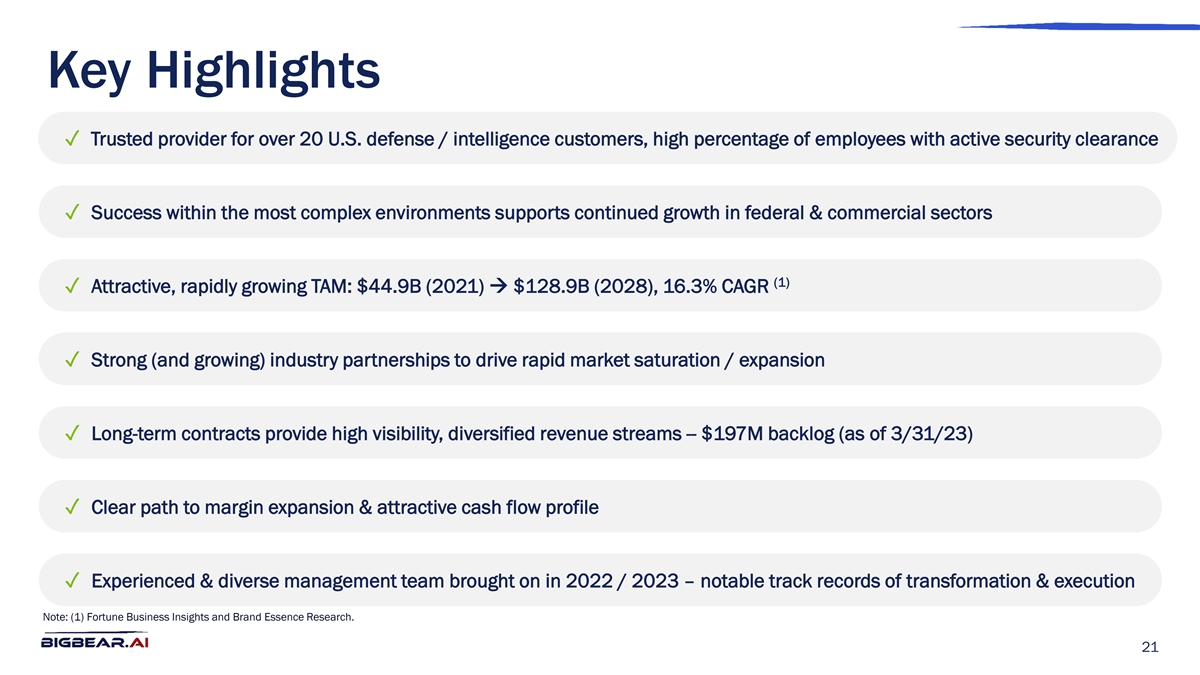
Key Highlights ✓ Trusted provider for over 20 U.S. defense / intelligence customers, high percentage of employees with active security clearance ✓ Success within the most complex environments supports continued growth in federal & commercial sectors (1) ✓ Attractive, rapidly growing TAM: $44.9B (2021) à $128.9B (2028), 16.3% CAGR ✓ Strong (and growing) industry partnerships to drive rapid market saturation / expansion ✓ Long-term contracts provide high visibility, diversified revenue streams -- $197M backlog (as of 3/31/23) ✓ Clear path to margin expansion & attractive cash flow profile ✓ Experienced & diverse management team brought on in 2022 / 2023 – notable track records of transformation & execution Note: (1) Fortune Business Insights and Brand Essence Research. 21

Appendix 22
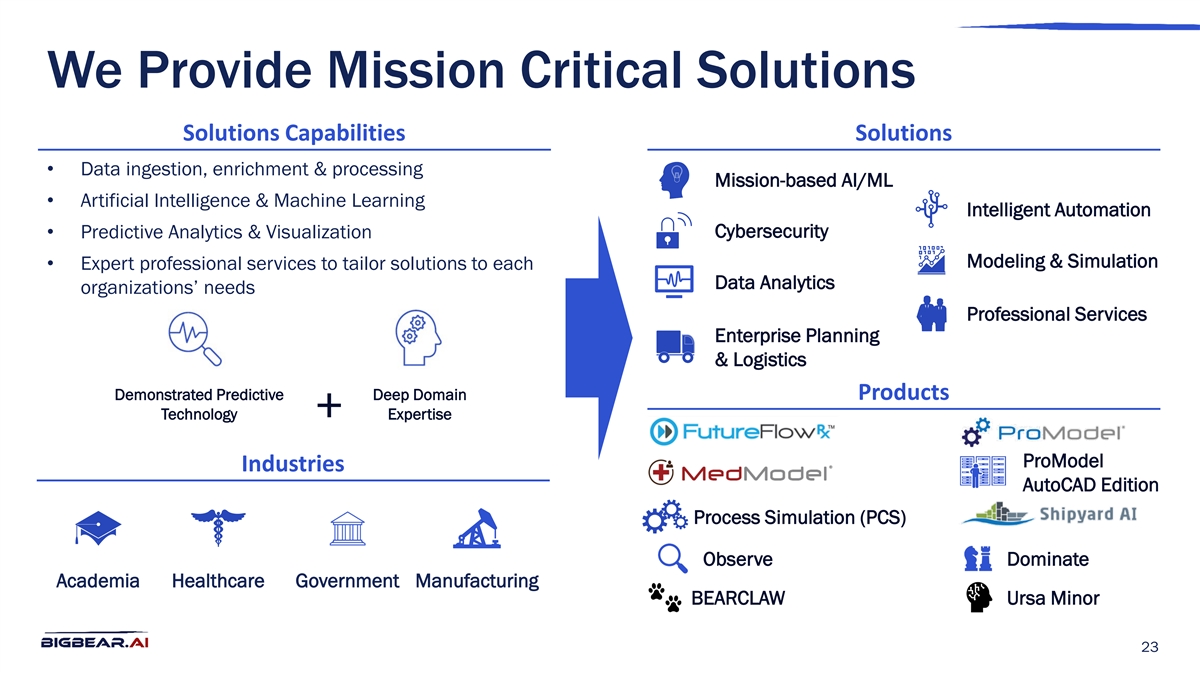
We Provide Mission Critical Solutions Solutions Capabilities Solutions • Data ingestion, enrichment & processing Mission-based AI/ML • Artificial Intelligence & Machine Learning Intelligent Automation Cybersecurity • Predictive Analytics & Visualization Modeling & Simulation • Expert professional services to tailor solutions to each Data Analytics organizations’ needs Professional Services Enterprise Planning & Logistics Demonstrated Predictive Deep Domain Products Technology Expertise + ProModel Industries AutoCAD Edition Process Simulation (PCS) Observe Dominate Academia Healthcare Government Manufacturing BEARCLAW Ursa Minor 23
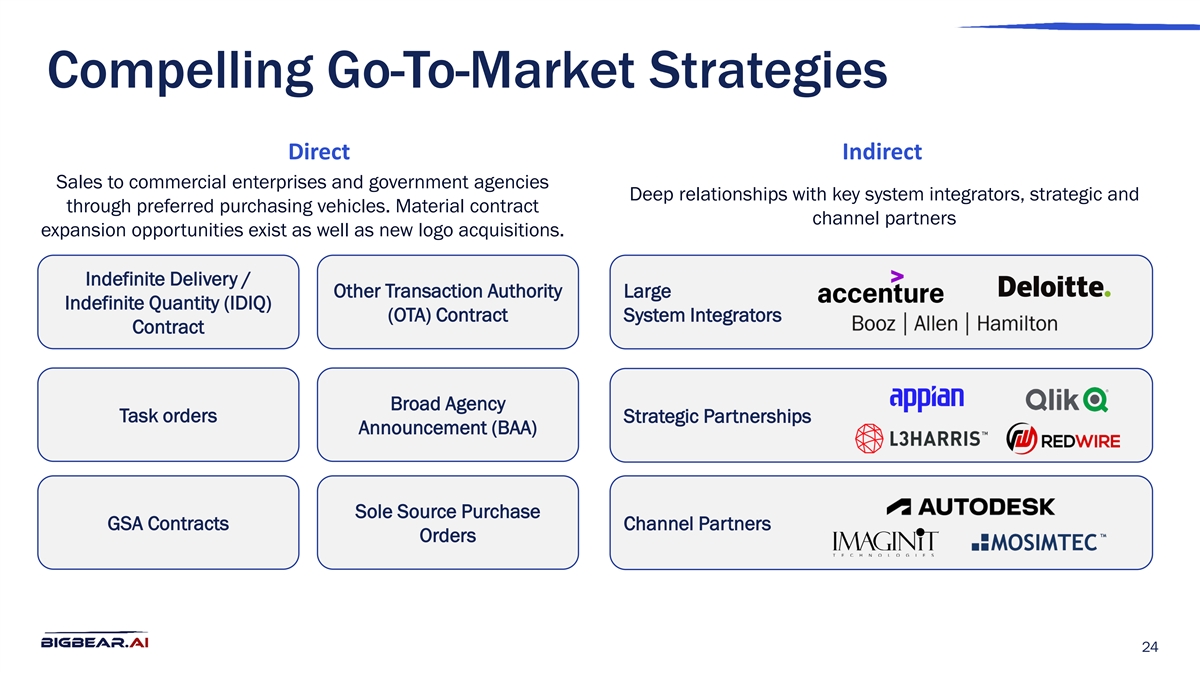
Compelling Go-To-Market Strategies Direct Indirect Sales to commercial enterprises and government agencies Deep relationships with key system integrators, strategic and through preferred purchasing vehicles. Material contract channel partners expansion opportunities exist as well as new logo acquisitions. Indefinite Delivery / Other Transaction Authority Large Indefinite Quantity (IDIQ) (OTA) Contract System Integrators Contract Broad Agency Task orders Strategic Partnerships Announcement (BAA) Sole Source Purchase GSA Contracts Channel Partners Orders 24
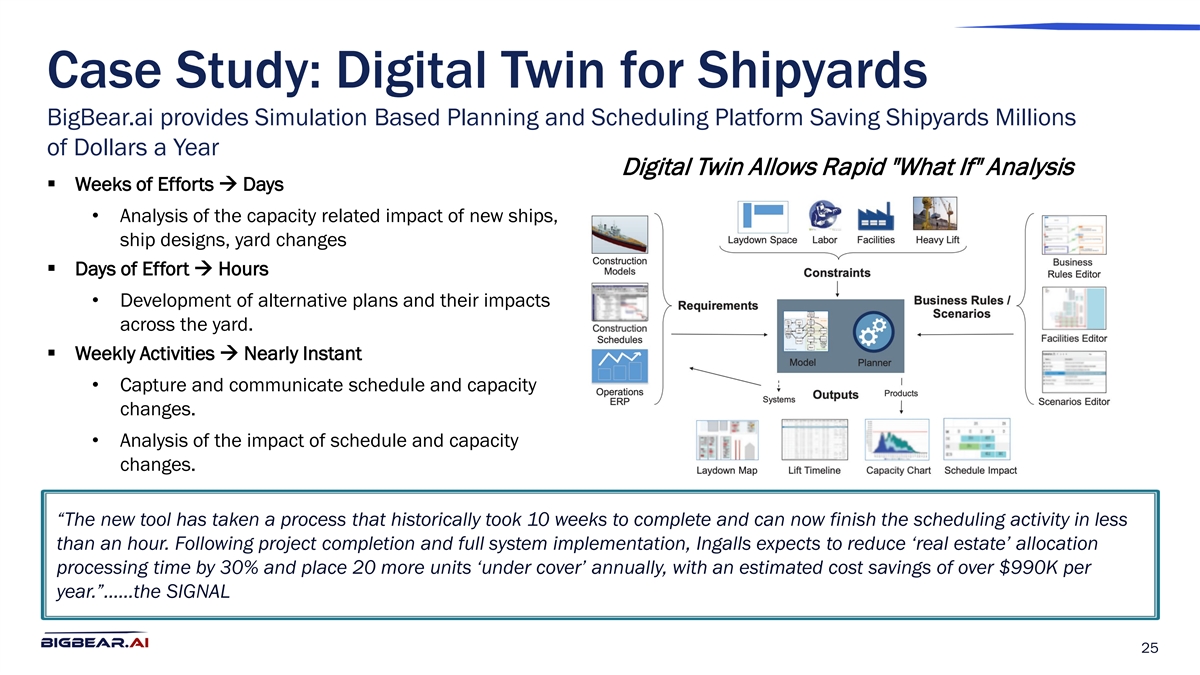
Case Study: Digital Twin for Shipyards BigBear.ai provides Simulation Based Planning and Scheduling Platform Saving Shipyards Millions of Dollars a Year Digital Twin Allows Rapid What If Analysis § Weeks of Efforts à Days • Analysis of the capacity related impact of new ships, ship designs, yard changes § Days of Effort à Hours • Development of alternative plans and their impacts across the yard. § Weekly Activities à Nearly Instant • Capture and communicate schedule and capacity changes. • Analysis of the impact of schedule and capacity changes. “The new tool has taken a process that historically took 10 weeks to complete and can now finish the scheduling activity in less than an hour. Following project completion and full system implementation, Ingalls expects to reduce ‘real estate’ allocation processing time by 30% and place 20 more units ‘under cover’ annually, with an estimated cost savings of over $990K per year.”......the SIGNAL 25
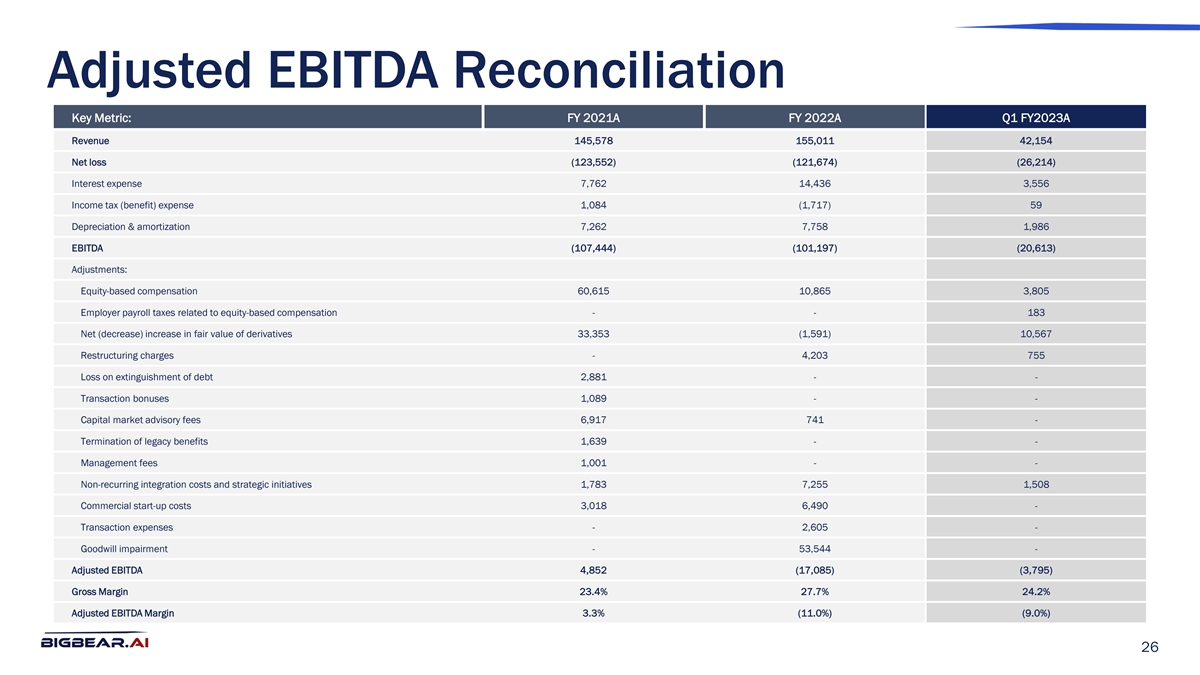
Adjusted EBITDA Reconciliation Key Metric: FY 2021A FY 2022A Q1 FY2023A Revenue 145,578 155,011 42,154 Net loss (123,552) (121,674) (26,214) Interest expense 7,762 14,436 3,556 Income tax (benefit) expense 1,084 (1,717) 59 Depreciation & amortization 7,262 7,758 1,986 EBITDA (107,444) (101,197) (20,613) Adjustments: Equity-based compensation 60,615 10,865 3,805 Employer payroll taxes related to equity-based compensation - - 183 Net (decrease) increase in fair value of derivatives 33,353 (1,591) 10,567 Restructuring charges - 4,203 755 Loss on extinguishment of debt 2,881 - - Transaction bonuses 1,089 - - Capital market advisory fees 6,917 741 - Termination of legacy benefits 1,639 - - Management fees 1,001 - - Non-recurring integration costs and strategic initiatives 1,783 7,255 1,508 Commercial start-up costs 3,018 6,490 - Transaction expenses - 2,605 - Goodwill impairment - 53,544 - Adjusted EBITDA 4,852 (17,085) (3,795) Gross Margin 23.4% 27.7% 24.2% Adjusted EBITDA Margin 3.3% (11.0%) (9.0%) 26
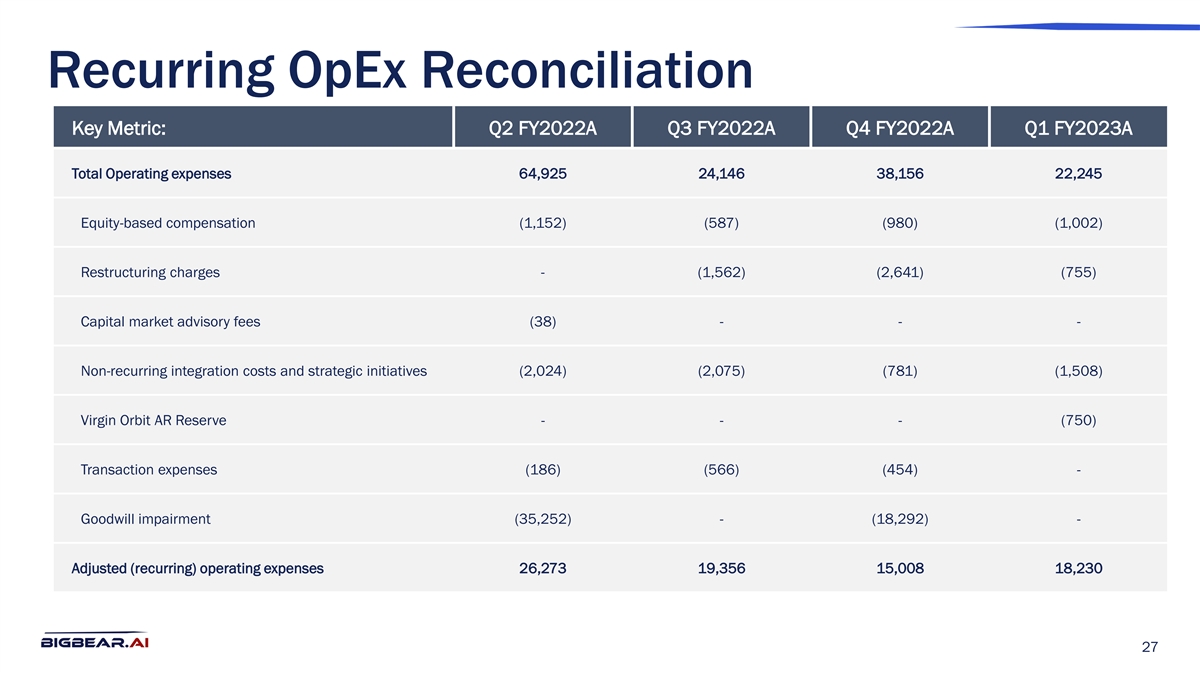
Recurring OpEx Reconciliation Key Metric: Q2 FY2022A Q3 FY2022A Q4 FY2022A Q1 FY2023A Total Operating expenses 64,925 24,146 38,156 22,245 Equity-based compensation (1,152) (587) (980) (1,002) Restructuring charges - (1,562) (2,641) (755) Capital market advisory fees (38) - - - Non-recurring integration costs and strategic initiatives (2,024) (2,075) (781) (1,508) Virgin Orbit AR Reserve - - - (750) Transaction expenses (186) (566) (454) - Goodwill impairment (35,252) - (18,292) - Adjusted (recurring) operating expenses 26,273 19,356 15,008 18,230 27

Thank You 28